Metrics & Dashboards

Charts that read the same data as the traces

Every widget queries the same warehouse the trace list does. When a dashboard shows p99 at 380 ms, the traces behind that number are one click away and they agree.

The surface

Every metric, with its type and its cardinality

The explorer lists what your services actually emit, not what a template expects. Cardinality is shown per metric, because that is the number that decides what a query costs.
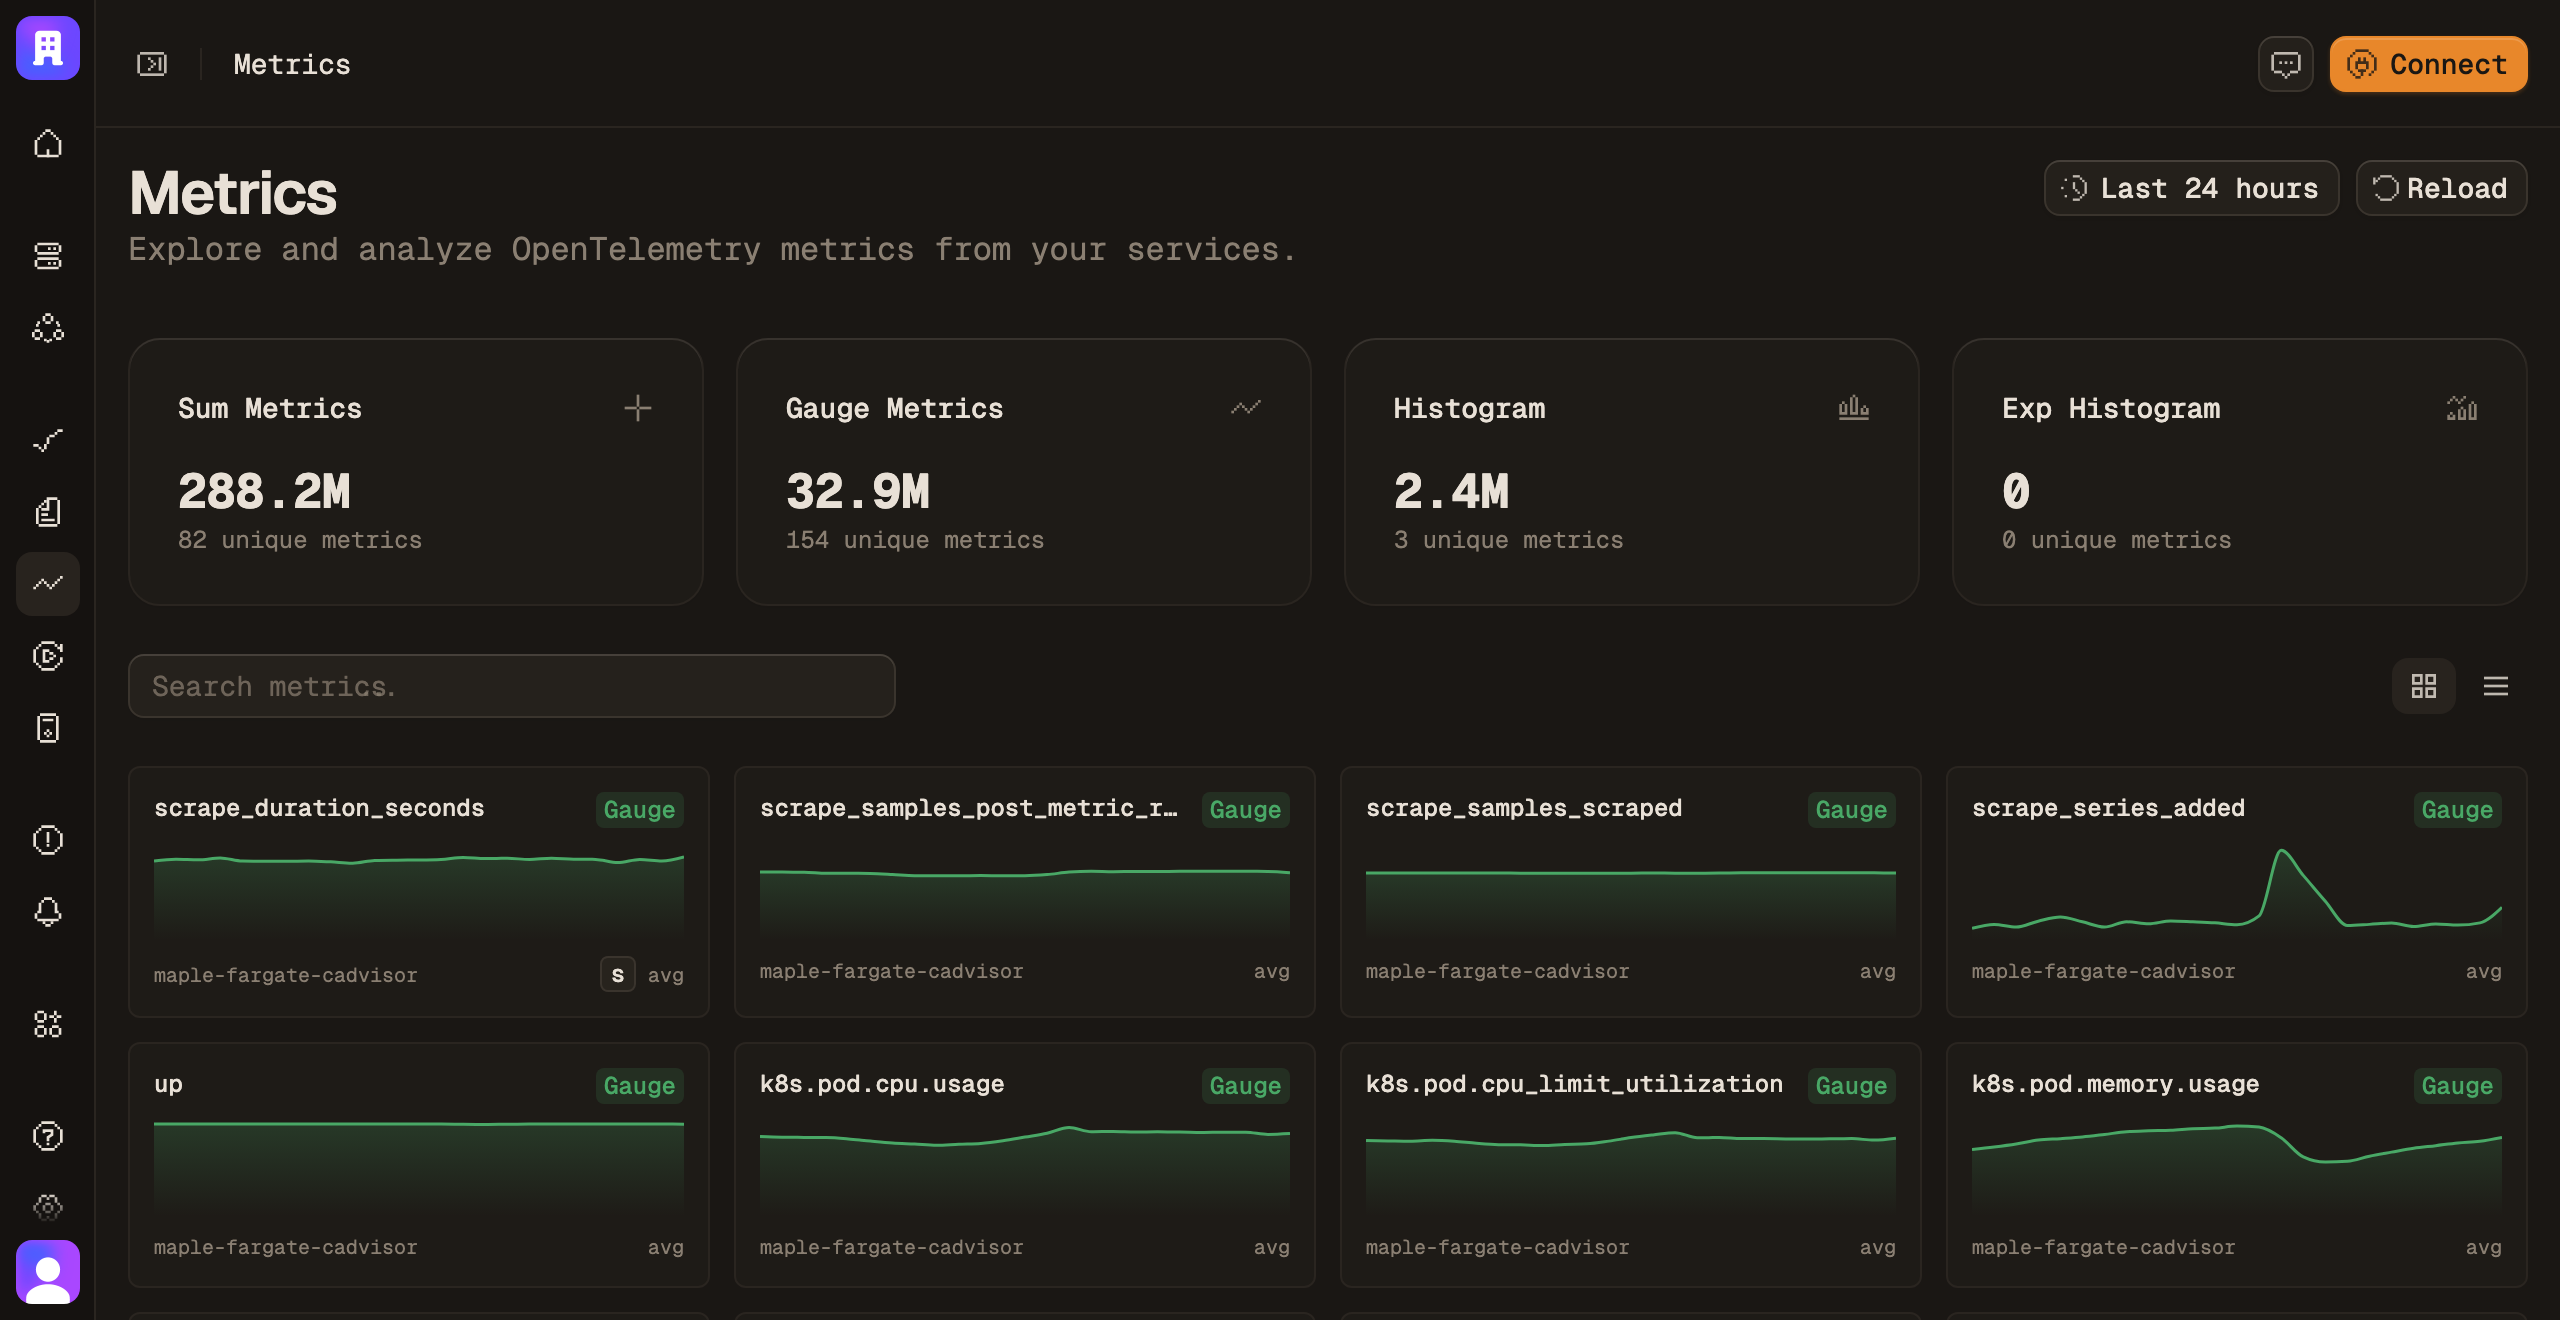
The metric explorer listing every metric with its type and cardinality
/metrics http.server.request.duration
signal
metrics
temporality
delta · cumulative
widgets
series · stat · table · histogram
percentiles
p50 · p95 · p99
variables
$service · $env

In motion

Log volume, by severity

Sixty five-minute buckets stacked by level. The warn cluster and the error blip after it are the shape a stat tile would have flattened away.

/logs live
logs · volume · last 5hLIVE
14.0K logsin selected range
4 severities · 60 buckets · 5m eachwarn cluster 11:10–11:40 · error blip 11:50

What it does

Building a board

time series
Time series
p50, p95 and p99 on one axis, each on its own percentile colour. Latency charts use the percentile tokens, so p99 is the same red-orange everywhere in the product.
stat + threshold
Stat and threshold
A single scalar with the line it must stay under. Apdex against its target, error rate against its budget — the comparison is part of the widget, not a note beside it.
$service
Variables
Declare $service or $env once and every widget on the board follows the selector. One dashboard covers twelve services instead of twelve dashboards drifting apart.
group by
Attribute autocomplete
Group-by suggestions come from the attributes that metric actually carries, so you cannot build a chart that groups by a key nothing emits.
select range
Chart to trace
Select a range on any latency chart and open the traces inside it. The chart is an index into the spans, not a picture of them.

Keep going

Surfaces that share this data

Point OTLP at Maple.

One endpoint, one key. Traces, logs, metrics and sessions land on the same trace id from the first request.